Process Capability (Cp & Cpk)
Process Capability
This is a story of Cpk and Ppk, before start reading please check blog six sigma on the lin: https://freeknowle.blogspot.com/2020/09/six-sigma.html
What is the Difference between Cp, Cpk and Pp,
PPk?
Cp Cpk vs Pp Ppk
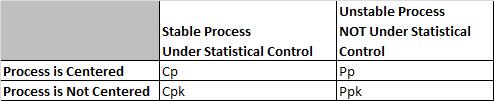
Cp and Cpk are called Process Capability. Pp
and Ppk are called Process Performance. In both cases we want to try to verify
if the process can meet to meet Customer
CTQs (requirements).
Cp, and Cpk are used for Process Capability.
Generally you use this when a process is under statistical control.
This often happens with a mature process that has been around for a while.
Process capability uses the process sigma value determined from either the
Moving Range, Range or Sigma control charts
Pp and PPk are used for Process Performance.
Generally you use this when a process is too new to
determine if it is under statistical control. Ex. there is a short
pre-production run or you are piloting a new process. Because there is not a lot of historical data we take large samples from the process to account for variation. Process Performance generally uses sample sigma in its
calculation.
In theory Cpk will always be greater than or
equal to Ppk. There are anomalies seen when the sample size is small and the
data represents a short amount of time where estimating using R will overstate
standard deviation and make Cpk smaller than Ppk. It is not real, there can
never be less variation in the long term since the long term is using all of
the data not just two pieces of data from every subgroup.
Evaluating process capability with Cp &
Cpk mirror what is done (and why it is done) when following the Pp & Ppk approach. The main difference is that you use Cp &
Cpk after a process has reached stability or statistical control.
Cpk vs Ppk
Ppk tells us how a
process has performed in the past and you cannot use it predict the future
because the process is not in a state of control.
If a process is in statistical control;
The values for Cpk and Ppk will converge to almost the same value because sigma and the sample standard deviation will be identical (use an F test to determine).
In other words, if Cpk == Ppk, the process is
likely in statistical control.
If a process is NOT in statistical control;
Cpk and Ppk values will be distinctly
different, perhaps by a very wide margin.
What is the Difference Between Cp and Cpk?
Cp vs Cpk
Cp and Cpk measure how consistent you are to
around your average performance.
The ‘k’ stands for ‘centralizing factor.’ The
index takes into consideration the fact that your data is maybe not centered.
Cpk tells us what a
process is capable of doing in future, assuming it remains in a state of
statistical control.
The Shooting at a Target Analogy
In a perfectly centered data set, there will
be no difference between Cp and Cpk. Think of throwing darts at a dart board
and having the center of the bull’s eye be the 0,0 on a cartesian plane and the
edges being out 3 units from that center point (we will use the edge of the
dart board or 3 and -3 as our USL and LSL). In a perfectly centered sample of
darts, your average distance from the center, or Mu, will be 0. A little
algebra will show us that that your Cpk and Cp numbers come out the same.
Min((0- -3)/3s , (3-0)/3s) = (3- -3)/6s = 1s .
Things get a little harrier when the darts
move up, say to be centered at an average of 2 units above center. Now you end
up with a Cpk of (3-2)/3s = 1/3s, but your Cp is still the same 1s as before.
It is important to note that because Cpk uses the minimum function, it will
always be equal to or smaller than the Cp for the same set of data.
What is Cpk?
The Parking a Car in the Garage Analogy
If you think of the walls of your garage –
where you have to fit your car in – they become the customer specification
limits. If you go past those limits, you will crash, and the customer will not
be happy!
If your process has a lot of variation, that
means the process average is all over the place. Not good for parking a car,
and not good for any other process. To give your parking process the best
chance of success you should work on reducing variation and centering.
If the car is too wide for the garage, nothing
you do to center the process will help. You have to change the dispersion of
the process (make the car smaller.)
If the car is a lot smaller than the garage,
it doesn’t matter if you park it exactly in the middle; it will fit and you
have plenty of room on either side. That’s one of the reasons the six sigma
philosophy focuses on removing variation in a process.
If you have a process that is in control and
with little variation, you should be able to park the car easily within the
garage and thus meet customer requirements. Cpk tells you the relationship between the size of the car,
the size of the garage and how far away from the middle of the garage you
parked the car.”
How to Calculate Cpk
Cpk is a measure to show how many standard
deviations the specification limits are from the center of the process. On some
processes you can do this visually. Others require an equation.
To find Cpk you need to calculate a Z score for the upper specification limit (called Z USL) and a Z
score for the lower specification limit (called Z LSL).
Since we are trying to measure how many
standard deviations fit between the center line and the specification limit you should not be surprised that the
value of those limits, the process mean, and the standard deviation are all components of the Z calculation.
Cp is an abbreviation. There are really two
parts; the upper and the lower denoted Cpu and Cpl respectively. Their
equations are:
Cpl = (Process Mean
– LSL)/(3*Standard Deviation)
Cpu = (USL – Process Mean)/(3*Standard
Deviation)
Cpk is merely the smallest value of the Cpl or
Cpu denoted: Cpk= Min (Cpl, Cpu)
Why are we dividing by 3 to find Cpk?
We know that any specification limit has an
upper bound and a lower bound. Because you know that 6 sigmas – or 6 standard
deviations account for nearly all eventualities on a process (assuming normal distribution) you shouldn’t be surprised to see the “/ 3”
because we are looking at only one side of the distribution.
Calculating Cpk using a Z Value
If you have a Z value, the equation is very easy;
Cpk can be determined by dividing the Z score
by three.
A z score is the same as a standard score; the
number of standard deviations above the mean.
![]()
Z = x – mean of the population / standard deviation.
Notes and Characteristics of Cpk
Cpk and Centered Processes
If a process is perfectly centered, it has a
Cp of 1. That would indicate that mean was 3 standard deviations away from the upper limit and the lower
limit.
A perfectly centered process – a process who
has a mean exactly in between the 2 specification limits (meaning halfway
between the two will have a Cpk of 1. How is this possible? Let’s check the
math.
If a process is perfectly centered, then we
know that the (USL – Process mean) equals the same thing as the (Process Mean –
LSL). Let’s call that A.
Z USL = USL – Process Mean / Standard
Deviation. then becomes Z USL = A/ Standard Deviation
Z LSL = Process Mean – LSL / Standard
Deviation then becomes Z LSL = A / Standard Deviation.

Comments
Post a Comment