Ishikawa diagram
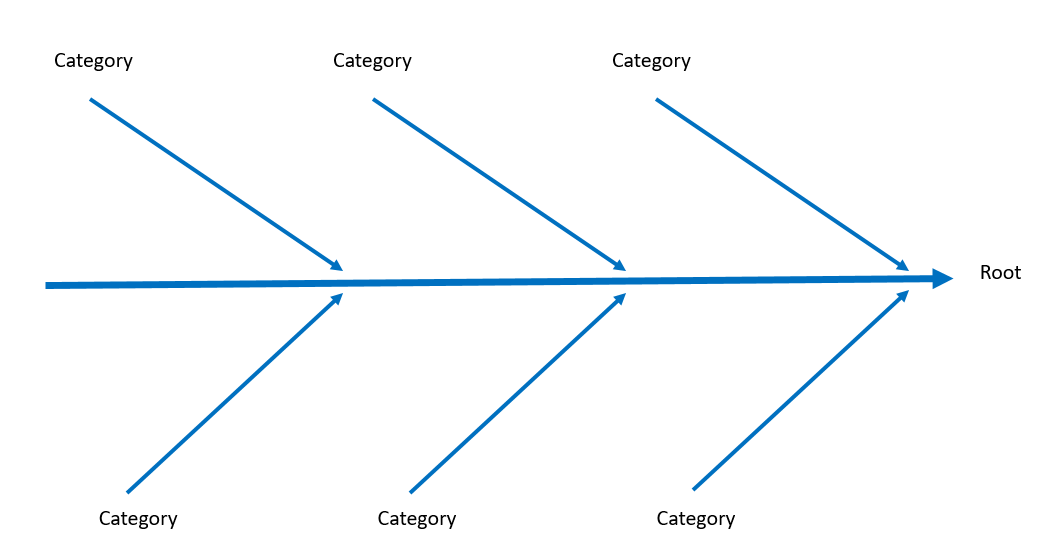
Ishikawa diagram is a tool that helps to identify, classify and show the possible causes of a particular problem, quality characteristic, aspect or hazard. The diagram graphically shows the relationship between a particular consequence and all the factors that affect it. This diagram was invented by Kaoro Ishikawa and is often used due to the appearance of the fishbone diagram.
Ishikawa diagram - goal
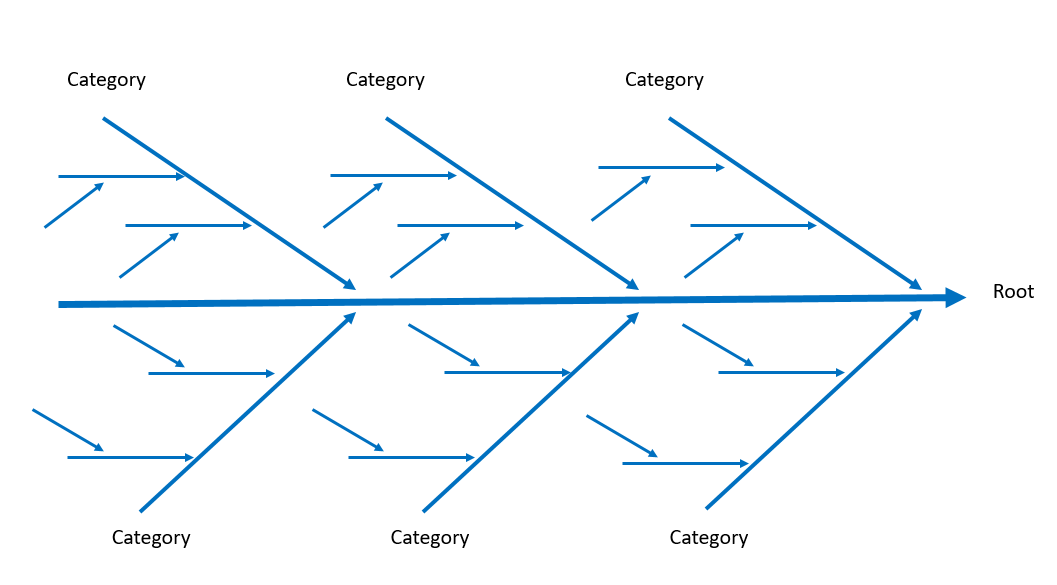
The goal of the Isikawa method is primarily to systematize knowledge. Through the research of influencing factors on a consequence, knowledge, about it is crystallized and collected, and that facilitates the analysis. The Ishikawa diagram is also known as the cause-and-effect diagram. Ishikawa diagram is a tool used to consider and show the relationship between a given consequence and its potential causes. Several potential causes are grouped into main categories (usually according to the 7M principle) and subcategories, so that their visual representation resembles a fish bone. Two types of Ishikawa methods can be identified: the Basic Method and the Comparative Method.
Ishikawa diagram –7M
Factors considered according to the 7M principle are:
Man, Machine, Material, Method, Management, Measure Milieu
Ishikawa - cause and effect diagram
Ishikawa diagram - identifying the cause
Comments
Post a Comment